
StrideOne is currently only open to early access members. Please enter your access PIN below.

Menu
Join StrideOne WaitlistContact
hey@getstride.com
Stride Health Group
Stride Health Group Ltd
Company No 05158025
Lamas Road
Badersfield
Norwich
England
NR10 5FB
UK

What's included in StrideOne.
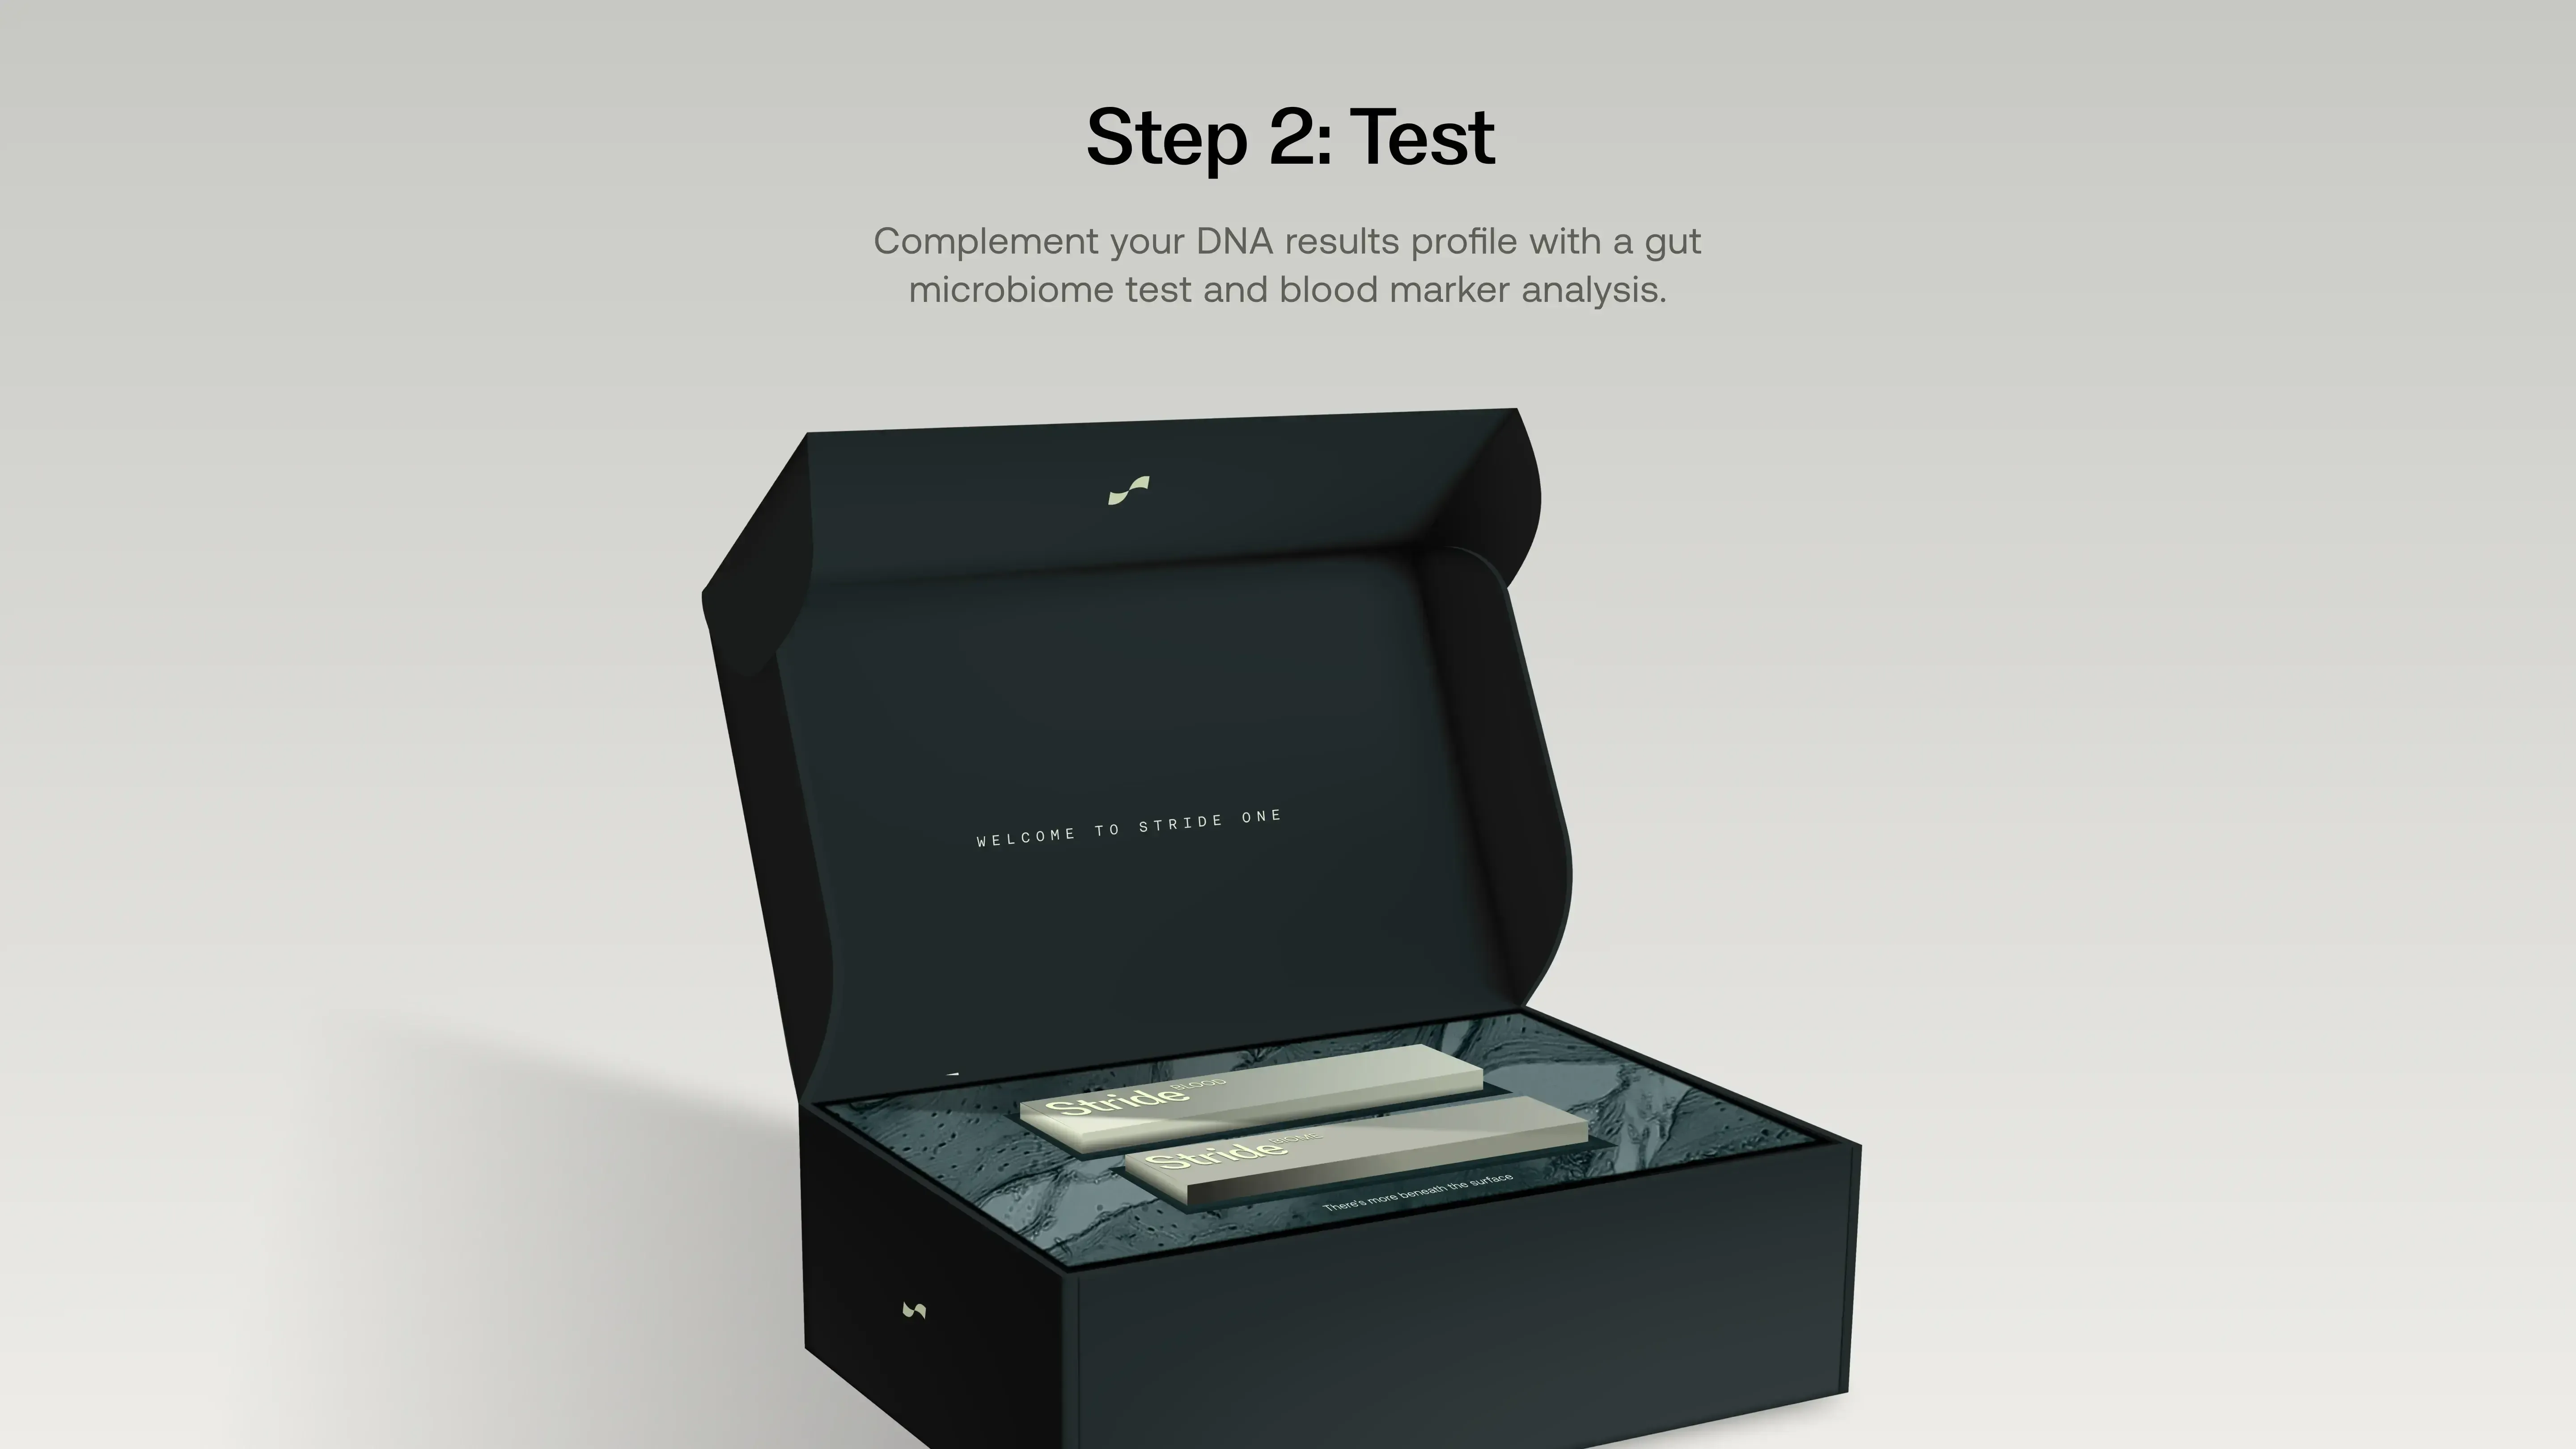
Get a complete, 360-degree picture of your health with the most comprehensive testing available.

Initial comprehensive testing
646
total biomarkers
Complete baseline assessment incorporating your existing DNA results (164 variants), alongside microbiome analysis (406 markers) and advanced blood biomarkers (76 tests). Establishes your comprehensive health foundation.

Bi-annual microbiome & blood retesting
482
follow-up markers
Track your progress with microbiome and blood biomarker (including bioage) retesting every 6 months. Monitor how your lifestyle optimisations are working and adjust your protocol based on real data changes.

Expert support & guidance
4
expert consultations
Quarterly video consultations with health experts, tailored action plans based on your results, and continuous support between tests. Human expertise guiding your health optimisation journey.
StrideDNA (164 Markers)
With access to our complete set of DNA reports, StrideOne allows you to build the fullest picture of your health.
Methylation Profile (5 reports)
Folate Cycle (5 genes)
The Folate Cycle converts dietary folate into usable forms for critical bodily processes. Understanding your genetic predispositions is crucial because variations like impaired MTHFR or DHFR function can significantly reduce folate processing efficiency.
Genes: DHFR, MTHFD1, MTHFR (A1298C), MTHFR (C677T)
Methionine Cycle (6 genes)
The Methionine Cycle drives methylation by producing SAMe - vital for gene expression, detox, and brain chemistry. Variants here can raise homocysteine and stall key pathways like BH4 and Transsulphuration. A methylation panel can uncover blocks behind fatigue, poor focus, and hormonal imbalance.
Genes: MTR, MTRR, FUT2, TCN2, PEMT, BHMT
The Transsulphuration Pathway (2 genes)
This pathway clears homocysteine by turning it into cysteine - fuel for glutathione and taurine. Genetic blocks here can impair detox, raise sulphite toxicity, and drive brain fog and burnout. Screening for these variants can reveal why your stress and recovery systems are under strain.
Genes: CBS (C699T), GSS
The BH4 Cycle (4 genes)
The BH4 Cycle makes key neurotransmitters like dopamine and serotonin and supports nitric oxide and thyroid function. It depends on folate and SAMe from other cycles. Variants can lead to mood issues, poor sleep, and low motivation. Knowing your BH4 profile helps explain and address deeper neurological imbalances.
Genes: MTHFR (A1298C), COMT, VDR, MAOA, MAOB
Urea Cycle (2 genes)
The Urea Cycle detoxifies ammonia by converting it into urea for safe excretion - a vital process linked to liver function, nitrogen balance, and brain health. It also produces arginine, needed for nitric oxide (NO), which supports blood flow and protects your heart. Variants here or low BH4 can impair NO production, increasing oxidative stress and cardiovascular risk.
Genes: NOS3, SOD2
Fitness (4 reports)
Training Intensity Response (14 genes)
Your genes play a key role in how you respond to different types of exercise - whether you’re better suited to power-based or endurance-focused training. Matching your workouts to your genetic profile can dramatically boost results, with studies showing up to three times greater improvement when training is aligned to your DNA.
Genes: ADRB2, CRP, COL5A1, TRHR, BDKRB2, IL6, ACTN3, VEGF, PPARA, ACE, AGT, NRF, VDR, PPARGC1A
Aerobic Training Response (4 genes)
VO₂max is a key measure of aerobic fitness, reflecting how efficiently your body uses oxygen during exercise. Genetics play a strong role in your capacity to improve VO₂max with training - some people respond more dramatically than others. Knowing your genetic potential helps tailor your fitness approach and set realistic goals.
Genes: ADRB2, CRP, PPARGC1A, VEGF
Recovery Efficiency (7 genes)
Your recovery rate is influenced by how well your body manages oxidative stress and inflammation after exercise. Genetic variants in key detox and inflammatory genes can slow recovery, making you more prone to fatigue, soreness, and overtraining. Understanding your recovery profile helps optimise rest, reduce injury risk, and get more from every workout.
Genes: SOD2, IL6, IL6R, CRP, TNF, GSTM1, GSTT1
Injury Predisposition (7 genes)
Your genes influence how well your body repairs connective tissue and manages inflammation - two key factors in injury risk. Variants in genes like COL1A1, CRP, and TNF can affect how resilient your joints and tendons are under stress. Knowing your genetic risk helps you train smarter, recover better, and prevent avoidable injuries.
Genes: GDF5, COL1A1, COL5A1, IL6, IL6R, CRP, TNF
Nutrition (24 reports)
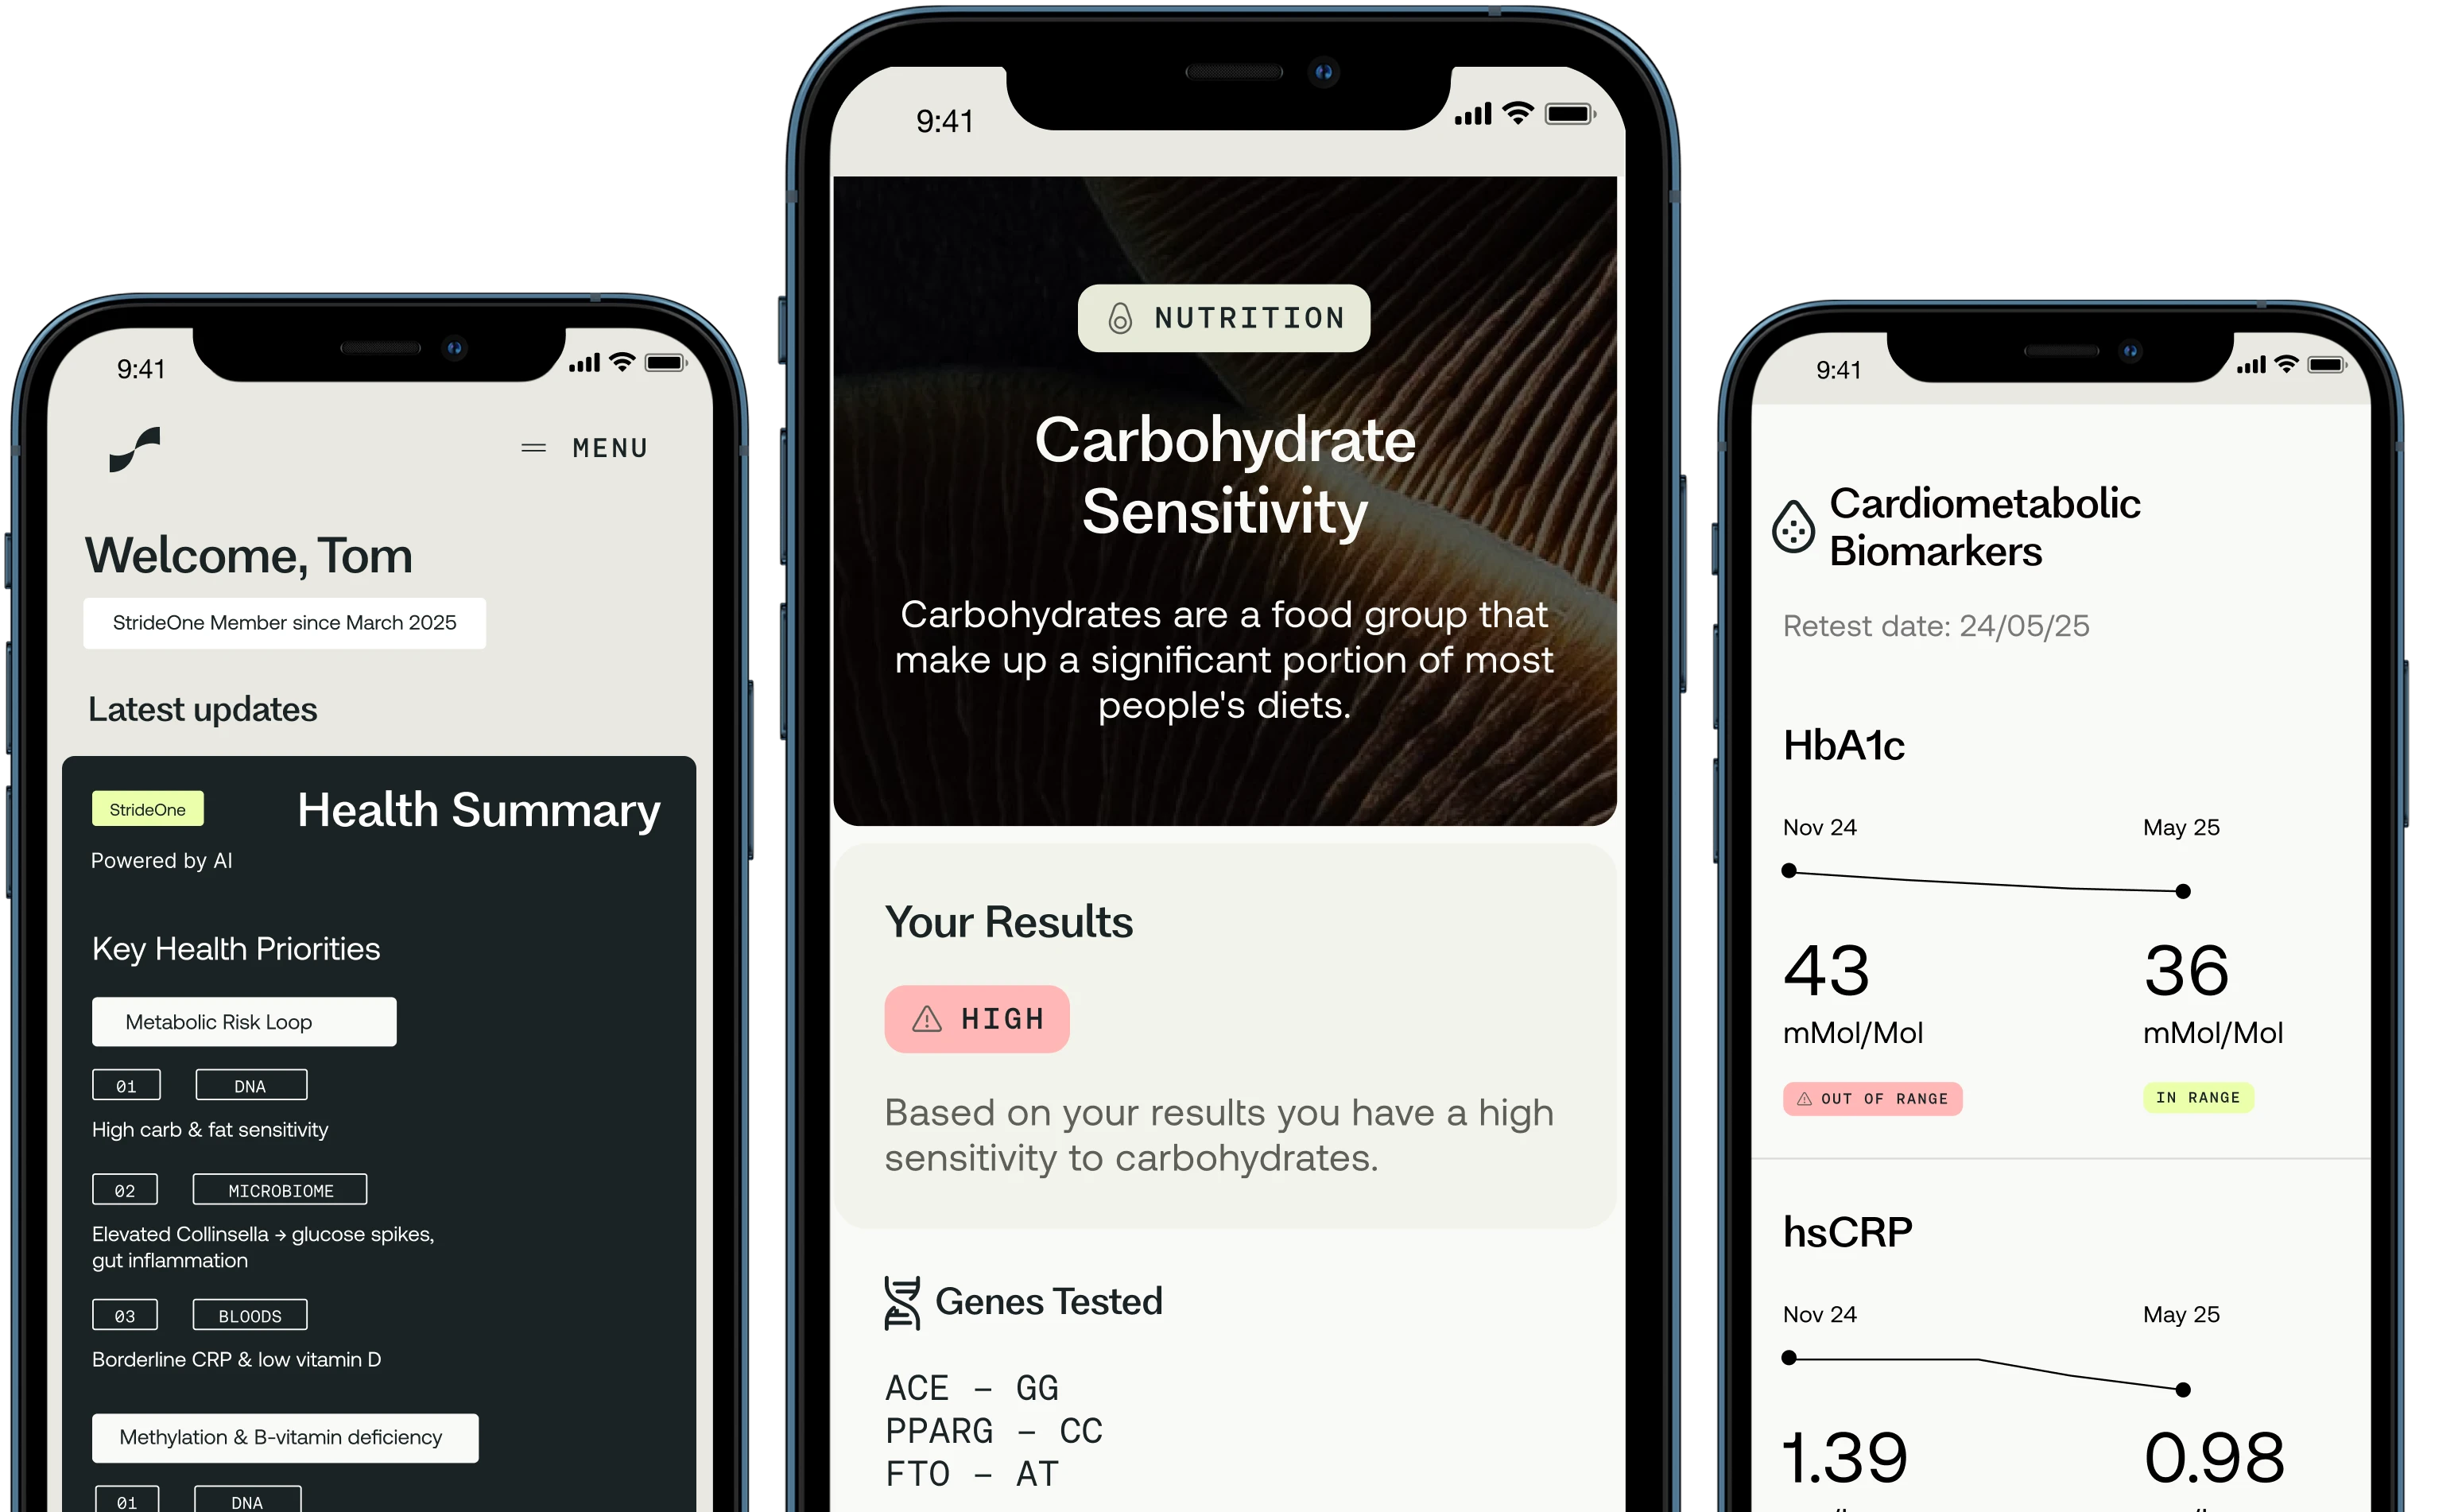
Carbohydrate Sensitivity (9 genes)
Your genes influence how well you process carbs, your insulin sensitivity, and how efficiently you use glucose. Some people are more prone to blood sugar spikes from high-GI foods, increasing the risk of insulin resistance. Knowing your genetic response helps you tailor carb choices to support steady energy, gut health, and long-term metabolic balance.
Genes: ACE, PPARG, TCF7L2, ADRB2, CLOCK, PLIN, INSIG, FTO, FABP2
Saturated Fat Sensitivity (15 genes)
This panel reveals how your body absorbs and processes fat, especially saturated fat, and how it affects your cholesterol levels. While fats are essential for energy, vitamin absorption, and cell health, some genotypes are more sensitive to saturated fat, raising the risk of high cholesterol and heart disease. Knowing your fat response helps you make smarter, heart-healthy choices.
Genes: APOC3, APOA5, APOA2, LPL, FABP2, FTO, CETP, LEPR, MC4R, PLIN, TCF7L2, PPARG, APOE, LIPC, APOE
Vitamin A (2 genes)
Your genes affect how efficiently you convert carotenoids into active vitamin A (retinol), with some people converting up to 60% less. Poor converters need more preformed vitamin A to support vision, immunity, and gene expression. Understanding your genetic efficiency helps ensure you’re meeting your body’s true vitamin A needs.
Genes: BCMO1, BCO1
Vitamin B2 (2 genes)
Riboflavin (vitamin B2) powers key coenzymes involved in energy production, fat metabolism, and detoxification. It also supports healthy homocysteine levels, especially in those with MTHFR variants that reduce enzyme efficiency by up to 65%. If you carry these variants, targeted B-vitamin support can help lower cardiovascular risk and optimise methylation.
Genes: MTHFR (C677T), MTHFR (A1298C)
Vitamin B6 (2 genes)
Vitamin B6 supports over 140 enzyme reactions, including those involved in brain function, blood vessel health, and antioxidant defence. It also helps lower homocysteine, especially important for those with low-functioning MTHFR variants. For these individuals, B6 can play a key role in reducing cardiovascular risk and supporting optimal methylation.
Genes: MTHFR (C677T), NBPF3
Vitamin B9 (3 genes)
Folate is central to one-carbon metabolism, working with B12, B6, and riboflavin to regulate homocysteine and support heart, immune, and brain health. MTHFR variants can reduce folate processing by up to 65%, raising homocysteine and disease risk. Knowing your genetic efficiency helps guide the right form and dose of folate for optimal protection.
Genes: MTHFR (C677T), MTHFR (A1298C), CBS
Vitamin C (3 genes)
Vitamin C supports collagen production, hormone synthesis, immunity, and antioxidant defence. But genetic variations in how you absorb and transport vitamin C can leave you with suboptimal levels - even with a good diet. Testing helps identify whether your genes may be limiting this vital nutrient’s impact on your skin, stress response, and long-term health.
Genes: SLC23A1, GSTT1, SOD2
Vitamin B12 (2 genes)
Vitamin B12 powers red blood cell formation, nerve health, and energy production, and plays a vital role in the methylation cycle. Some people have gene variants that reduce B12 absorption and transport, leading to deficiency even with adequate intake. Testing reveals if your genetics are limiting B12 activity and if you need a more bioavailable form or higher intake.
Genes: FUT2, TCN2
Vitamin D (1 gene)
Vitamin D supports bone strength, muscle function, immunity, and insulin signalling. But your genetic makeup can affect how well you activate, transport, and respond to it. Variants in genes like VDR and CYP2R1 may mean you need more vitamin D than others to maintain optimal levels. Understanding your genetic profile helps tailor your intake to match your body’s true needs.
Genes: VDR
Vitamin E (2 genes)
Vitamin E protects cells from oxidative stress, supports brain and heart health, boosts immunity, and may slow cellular aging. However, genetic differences in absorption and transport can lead to lower circulating levels, even with a good diet. Knowing your genetic profile can uncover hidden needs and help you optimise vitamin E’s protective effects.
Genes: CYP4F2, ZPR1
Iron Overload (1 gene)
Iron is vital for oxygen transport, immune defence, and healthy skin, hair, and nails. But certain genetic variants, especially in the HFE gene, can lead to excessive iron absorption and increase the risk of iron overload (hemochromatosis). Identifying these variants can help you manage iron intake and prevent long-term damage from hidden excess.
Genes: HFE
Iron Deficiency (3 genes)
Iron is essential for oxygen transport, immune defence, brain function, and muscle activity. While most focus is on deficiency, some genetic variants – like those in the TMPRSS6 gene – can disrupt how your body regulates iron through hepcidin, affecting absorption and storage. Understanding your genetic control of iron balance helps fine-tune intake and avoid both deficiency and overload.
Genes: TMPRSS6, TFR2, TF
Antioxidants (3 genes)
Your antioxidant system defends cells against free radicals, protecting energy levels, thyroid health, immunity, and insulin sensitivity. But genetic differences in key detox enzymes can weaken this defence, raising the risk of chronic diseases. Identifying these variants reveals whether your body needs extra support from diet or lifestyle to boost resilience.
Genes: CAT, GPX1, SOD2
Omega 3 (2 genes)
Omega-3s help lower chronic inflammation and support brain, eye, and nerve health. But your genes affect how well you convert ALA and EPA into DHA – the most active form. If you're a poor converter, you may need more DHA from diet or supplements to meet your body’s needs and boost resilience.
Genes: IL6, TNF
Lactose Intolerance (1 gene)
The LCT gene controls your ability to produce lactase – the enzyme needed to digest lactose in dairy. While most people lose this ability after infancy, some have a genetic trait called lactase persistence, allowing them to tolerate dairy into adulthood. Knowing your LCT status helps you understand whether dairy is a friend or foe to your digestion.
Genes: LCT/MCM6
Coeliac Predisposition (1 gene)
Gluten is a protein found in wheat, barley, and rye but certain HLA gene variants can trigger an immune reaction to it, increasing your risk of Coeliac disease. These genes influence how your immune system responds in the gut. Knowing your HLA status can clarify whether gluten may be harming your health behind the scenes.
Genes: HLA DQ2/DQ8
Fructose Intolerance (1 gene)
Fructose is a natural sugar found in fruit, but variants in the ALDOB gene can impair its metabolism, leading to hereditary fructose intolerance. This can cause nausea, bloating, and discomfort after eating fructose-containing foods. Identifying ALDOB mutations helps explain unexplained digestive symptoms and guides smarter food choices.
Genes: ALDOB
Salt Sensitivity (2 genes)
While the body needs some salt for muscle and fluid balance, certain genetic variants can make you more sensitive to sodium – raising your risk of high blood pressure, heart disease, and stroke. Knowing your salt sensitivity helps you take proactive steps to protect your cardiovascular health.
Genes: ACE, AGT
Alcohol Response (1 gene)
The ADH1C gene influences how your body breaks down alcohol. Some variants produce a slower-acting enzyme, which is linked to higher HDL (“good”) cholesterol levels in moderate drinkers. While this doesn’t affect alcohol tolerance, it can reveal how your genetics shape the impact of alcohol on heart health.
Genes: ADH1C
Caffeine Sensitivity (1 gene)
Your response to caffeine is shaped by your genetics – specifically how quickly your body breaks it down. Fast metabolisers may handle caffeine well, while slow metabolisers are more likely to experience anxiety, sleep issues, and cardiovascular effects. Knowing your caffeine metabolism can help you tailor your intake for better focus, energy, and long-term health.
Genes: CYP1A2
Detoxification Phase I - Toxin Generation Speed (2 genes)
High-heat cooking of meats can produce harmful compounds like HCAs and PAHs, which damage cells through oxidative stress. Your genes influence how efficiently your body detoxifies these compounds. Certain variants may slow this process, increasing your risk of long-term cellular damage. Understanding your genetic detox capacity can guide safer cooking and dietary choices.
Genes: CYP1A2, EPHX1
Detoxification Phase II - Cruciferous Vegetable Needs (2 genes)
Phase II detox relies on enzymes like GSTM1 to neutralise harmful compounds in the liver. Some people carry a deleted version of the GSTM1 gene, meaning this key enzyme is missing – reducing detox capacity. If you have this variant, increasing your intake of cruciferous vegetables can help support your body’s natural detox pathways.
Genes: GSTM1, GSTT1
Sugar Preferences (1 gene)
Excess sugar can lead to fatigue, brain fog, and long-term health issues. A specific genetic variant influences how your body regulates blood glucose and how strongly you crave sweet foods. Carriers of this variant may consume more sugar and face a higher risk of cavities and metabolic imbalances. Knowing your sugar response can help you take control of cravings and protect your health.
Genes: GLUT2
Bitter Taste Perception (1 gene)
Your ability to taste bitterness is influenced by the TAS2R38 gene, which encodes a receptor that detects bitter compounds in foods like broccoli and brussels sprouts. People with certain variants are “supertasters” and may find these foods more intense or unpleasant. Knowing your taste genetics can help explain food preferences – and guide strategies for improving dietary variety.
Genes: TAS2R38
Sleep & Stress (5 reports)
Chronotype (9 genes)
Your genetic chronotype shapes your internal body clock - determining when you naturally feel most alert or sleepy. It influences your energy patterns, hormone cycles, and even workout or productivity timing. By analysing multiple genes linked to circadian rhythm, we can identify whether you're more of a morning lark or a night owl, helping you align your lifestyle with your biology.
Genes: RNASEL, VIP, PER3, PER2, RASD1, FBLX3, PLCL1, RGS16, HCRTR2
Sleep Quality (2 genes)
Sleep is essential for mental and physical recovery but how easily you fall and stay asleep can be influenced by your genes. Variants in genes like ADA and MEIS1 affect sleep depth, efficiency, and sensitivity to disturbances. Understanding your genetic sleep profile can help you optimise rest, manage stress, and improve overall wellbeing.
Genes: ADA, MEIS1
Caffeine & Sleep Response (1 gene)
Caffeine keeps you alert by blocking adenosine, the chemical that builds sleep pressure in your brain. But certain variants in the ADORA2A gene can make you more sensitive to caffeine’s effects - leading to disrupted sleep or insomnia, especially if consumed late in the day. Your genetic profile helps determine how caffeine affects your sleep and circadian rhythm.
Genes: ADORA2A
Stress Tolerance (10 genes)
Your body’s response to stress is driven by hormones like cortisol and adrenaline but how you process stress is also shaped by your genes. Variants in key genes can influence dopamine sensitivity, emotional regulation, and how resilient you are under pressure. Understanding your genetic stress profile helps you manage triggers more effectively and build long-term resilience.
Genes: XKR6, MIR2113, BDNF, COMT, DCAF5, FKBP5, HTR2A, LINCOO461, NOS1, OXTR
Warrior or Strategist (1 gene)
The COMT gene influences how quickly your brain clears dopamine during stress, shaping how well you perform under pressure. Fast metabolisers tend to stay calm in high-threat situations, while slow metabolisers may excel in complex, detail-heavy tasks. Your COMT type can help explain your natural stress tolerance and the environments where you thrive best.
Genes: COMT
Skin (7 reports)
Skin Ageing (4 genes)
Skin ageing is driven by both genetics and environment - with UV exposure accounting for up to 90% of external ageing. Genes involved in collagen, elastin, and skin remodelling influence how well your skin maintains its structure over time. Small genetic variations can accelerate sagging, wrinkles, and loss of elasticity. Knowing your skin-ageing profile helps guide preventative care from the inside out.
Genes: MMP1, MMP3, COL1A1, ELN
Oxidative Stress (3 genes)
UV exposure triggers free radical production in the skin, accelerating ageing and cellular damage. Your body relies on antioxidant enzymes to neutralise these effects but genetic variations in genes like SOD2, CAT, and GPX1 can reduce their efficiency. If your defences are genetically weaker, you may be more susceptible to oxidative stress from sun and pollution.
Genes: SOD2, CAT, GPX1
Sensitivity to Refined Carbohydrate & Glycation (9 genes)
Advanced glycation end products (AGEs) build up when excess sugar reacts with proteins in the body, accelerating ageing and increasing the risk of chronic disease. Your genetic sensitivity to refined carbs - shaped by genes like ACE, PPARG, PLIN, and TCF7L2 - influences how much glucose lingers in your system to drive this damage. Knowing your glycation risk helps you personalise your carb intake to slow cellular ageing.
Genes: ACE, PPARG, TCF7L2, ADRB2, FTO, CLOCK, PLIN, INSIG, FABP2
Pigmentation (2 genes)
Melanin determines your skin, hair, and eye colour - and your natural protection against UV damage. Genetic variants in genes like MC1R and SLC24A5 influence how much melanin you produce and how it’s distributed. Lighter skin tones may be more vulnerable to sun damage but can produce vitamin D more efficiently. Understanding your melanin profile helps balance sun protection with vitamin D needs.
Genes: MC1R, SLC24A5
Nickel Sensitivity (3 genes)
Nickel is a common trigger for contact allergies, often found in jewellery and everyday items. Variants in genes like GSTM1 and GSTT1 can reduce your body’s ability to detoxify allergens, while TNF influences how strongly you react to irritants. Your genetic profile may explain heightened sensitivity and guide ways to reduce exposure and inflammation.
Genes: GSTM1, GSTT1, TNF
Detoxification (3 genes)
Your body detoxifies harmful substances by converting them into water-soluble forms for safe elimination. Variants in detox genes like EPHX1, GSTM1, and GSTT1 can reduce this efficiency, increasing your vulnerability to oxidative stress and toxin build-up. Knowing your genetic detox profile helps you target support through diet, lifestyle, and supplementation.
Genes: EPHX1, GSTM1, GSTT1
Skin Inflammation (2 genes)
Inflammation is your body’s frontline defence against injury, infection, and cell damage but when poorly regulated, it can become chronic and harmful. Variants in genes like IL6 and TNF can heighten inflammatory responses, increasing your risk for accelerated ageing and long-term health issues. Understanding your inflammation profile allows for targeted nutritional and lifestyle strategies to restore balance.
Genes: IL6, TNF
StrideBiome (406 biomarkers)
Your gut microbiome is constantly evolving in response to your diet, lifestyle and even your stress levels... track changes easily with StrideOne.
Overall Gut Health (5 reports)
Health Index
The balance of good vs. bad bacteria is one of the clearest indicators of gut health. A strong ratio means your microbiome is working to protect, not harm, your body.
Diversity Score
A diverse microbiome is a resilient one - better able to fight off infection, adapt to change, and maintain long-term health. Low diversity is a common marker in chronic disease.
Richness
The more species you have, the more functions your gut can perform. High richness supports digestion, immunity, and protects against GI issues.
Balance
Even spread matters. If one species dominates, it can suppress others and disrupt your gut’s ecosystem. Balance keeps everything functioning smoothly.
Key Bacteria
Faecalibacterium: Reduces inflammation, supports the gut barrier, and protects against metabolic and digestive disorders.
Bifidobacterium: Essential for immune support, inflammation reduction, and balanced digestion.
Lactobacillus: Aids nutrient metabolism, inflammation regulation, and supports overall gut and metabolic health.
Gut-brain Axis (4 reports)
SCFAs
Short-chain fatty acids help maintain the gut-brain barrier and reduce neuroinflammation, supporting cognitive health.
Serotonin
Mostly produced in the gut, it regulates mood and bowel movements, linking digestion to emotional wellbeing.
Dopamine & Norepinephrine
Regulated by gut microbes, these shape cognition and stress response.
GABA
A calming neurotransmitter produced by some gut bacteria, supporting anxiety reduction and gut lining health.
Metabolic Health (3 reports)
Bacteroidota:Bacillota Ratio
This well-studied microbial ratio offers insight into how your gut composition may relate to metabolic balance. Higher levels of Bacillota are often linked with obesity, while Bacteroidota is more commonly associated with leanness and metabolic health. Monitoring this ratio can highlight how your microbiome may be influencing weight regulation.
Proteobacteria Abundance
Proteobacteria are typically present in low levels, but elevated abundance has been repeatedly linked to inflammation and metabolic dysfunction. Their presence may signal a shift toward a microbiome state associated with obesity or insulin resistance.
Diversity Index
A diverse microbiome supports flexibility, nutrient metabolism, and glucose regulation - all crucial for metabolic health. Lower diversity has been associated with higher obesity risk, making this a valuable marker for understanding how well your gut ecosystem is equipped to support long-term metabolic stability.
Digestive Health (3 reports)
Bacteroidota:Bacillota Ratio
This ratio helps highlight how well your microbiome supports digestion. A higher proportion of Bacteroidota is often linked with a healthier gut environment, while elevated Bacillota may be associated with digestive issues like IBD. It’s a useful indicator of how your microbial balance could be influencing gut function.
Diversity Index
Microbial diversity supports a broader range of digestive functions - from breaking down food to maintaining gut lining integrity. A more diverse microbiome is better equipped to adapt to dietary changes and protect against GI disturbances, making this an important marker of digestive resilience.
SCFA Enrichment
SCFA-producing bacteria play a central role in calming gut inflammation and strengthening the gut lining. Their activity supports nutrient absorption and digestive comfort. This score reflects how effectively your microbiome may be helping to maintain a healthy digestive environment.
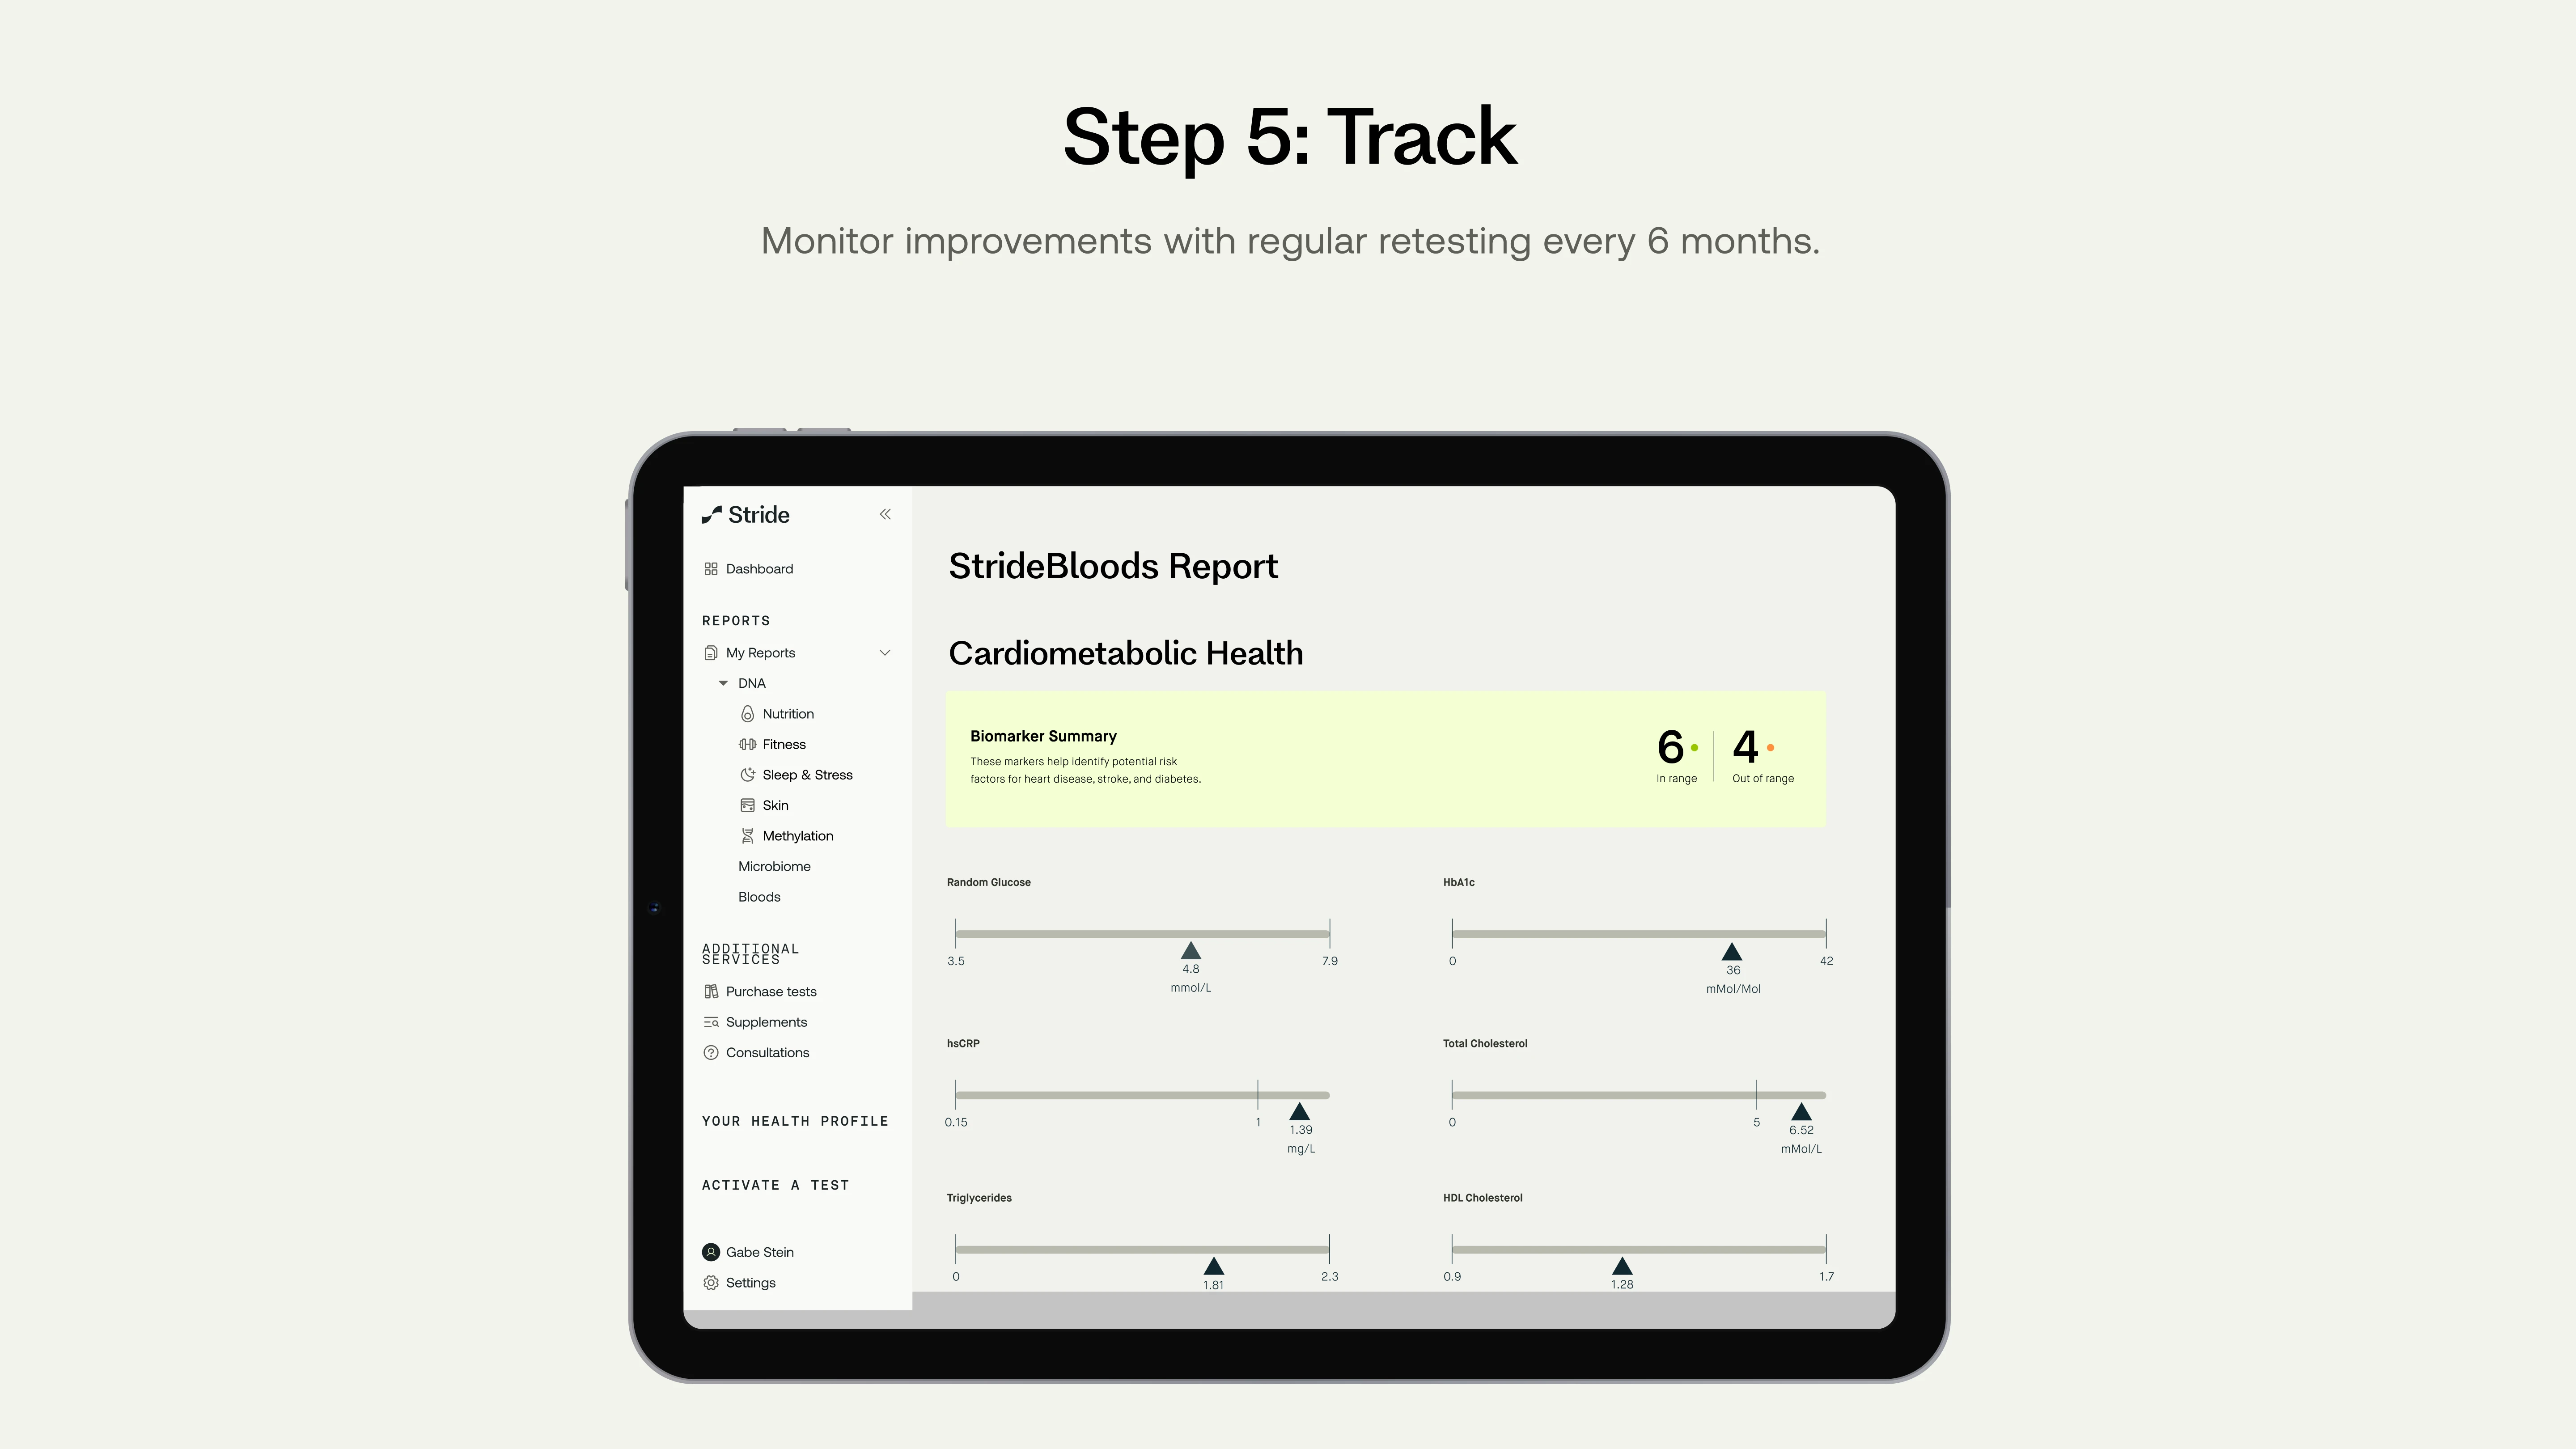
StrideBloods (76 biomarkers)
Blood biomarkers are perhaps the most accurate and relevant indicators of current health status. Regular testing allows you to take control and monitor your progress.
Cardiometabolic Health (13 markers)
Apolipoprotein A1
The main protein component of HDL particles.
Why measure? Provides more detailed information about your HDL particles' quality and function beyond just HDL cholesterol levels.
Apolipoprotein B
The main protein found in LDL and other atherogenic lipoprotein particles.
Why measure? Offers a more accurate assessment of cardiovascular risk than standard lipid tests, as it reflects the actual number of potentially harmful particles.
Apolipoprotein B/A1 Ratio
The balance between potentially harmful and protective cholesterol carriers.
Why measure? This ratio is considered one of the strongest predictors of heart disease risk, offering more precise insights than standard cholesterol testing.
hsCRP (High-sensitivity C-reactive protein)
Measures low-level inflammation in your body.
Why measure? Inflammation plays a central role in heart disease development. Elevated levels indicate increased cardiovascular risk even when cholesterol levels appear normal.
HbA1c
Measures your average blood glucose over the past 2–3 months.
Why measure? Provides insight into long-term glucose control, helping identify pre-diabetes and diabetes risk, which may significantly increase cardiovascular disease risk.
HDL Cholesterol
Measures "good" cholesterol that helps remove other forms of cholesterol from your bloodstream.
Why measure? Higher levels of HDL are protective against heart disease, while low levels indicate cardiovascular disease risk.
HDL % of Total Cholesterol
Measures the percentage of your total cholesterol that is HDL.
Why measure? This ratio helps evaluate the balance between protective and harmful cholesterol types in your blood.
LDL Cholesterol
Measures "bad" cholesterol that can build up in your arteries.
Why measure? LDL is a primary driver of atherosclerosis (plaque build up in arteries) and cardiovascular disease risk, making it a key target for heart disease prevention.
Lipoprotein (a)
A specialised type of LDL particle with genetic determinants.
Why measure? Elevated Lp(a) significantly increases cardiovascular risk independent of other factors and doesn't respond to traditional cholesterol-lowering approaches.
Non-HDL Cholesterol
Measures all cholesterol types except HDL.
Why measure? Provides a more comprehensive assessment of cardiovascular risk than LDL alone and is a risk marker for dyslipidemia and metabolic syndrome.
Random Glucose
Measures your blood sugar levels at time of testing.
Why measure? Helps assess your current glucose regulation and screen for potential metabolic issues that could affect heart health and diabetes risk.
Total Cholesterol
Measures the total cholesterol level in your blood.
Why measure? Elevated total cholesterol is a risk factor for atherosclerosis and heart disease.
Triglycerides
Measures levels of this type of fat in your blood.
Why measure? High triglycerides are linked to increased risk of heart disease and can indicate metabolic issues including insulin resistance.
Hormone Health (15 markers)
Anti-TG (Thyroglobulin Antibodies)
Antibodies targeting thyroglobulin, a protein essential for thyroid hormone production.
Why measure? Detects autoimmune thyroid conditions like Hashimoto's thyroiditis, often before thyroid hormone levels change.
Cortisol
The primary stress hormone produced by the adrenal glands.
Why measure? Helps assess adrenal function and stress response, with implications for energy, immunity, and metabolic health.
D.H.E.A. Sulphate (DHEAS)
An adrenal hormone that serves as a precursor to sex hormones.
Why measure? Assesses adrenal function and can indicate stress response capacity, with implications for energy, immunity, and ageing.
Free Androgen Index (FAI)
Measures the ratio of total testosterone to sex hormone binding globulin.
Why measure? Provides an estimate of biologically available testosterone, helping identify subtle hormonal imbalances that might be missed when looking at individual hormone measurements alone.
FT3 (Free Triiodothyronine)
The unbound, biologically active form of T3, the most potent thyroid hormone.
Why measure? Provides the most direct indicator of thyroid hormone activity at the cellular level, crucial for assessing metabolic function and thyroid status in complex cases.
FT4 (Free Thyroxine)
The unbound, biologically active form of thyroxine (T4) that's available for tissues to use.
Why measure? Provides a more accurate assessment of thyroid function than total T4, helping diagnose hypo/hyperthyroidism and monitor thyroid treatment effectiveness.
Luteinising Hormone (LH)
A pituitary hormone that works with FSH to regulate reproductive function.
Why measure? In women, helps monitor ovulation; in men, it stimulates testosterone production. Abnormal levels can indicate issues with reproductive health or pituitary function.
Oestradiol
The primary female sex hormone, present in both women and men.
Why measure? Helps assess reproductive function, bone health, and metabolic status. Imbalances can affect mood, energy, weight, and sexual function.
Progesterone
A reproductive hormone essential for menstrual cycle regulation and pregnancy.
Why measure? Helps evaluate menstrual irregularities, fertility issues, and hormonal balance. Adequate progesterone is crucial for mood stability and healthy menstrual function.
Prolactin
A hormone primarily responsible for milk production in women.
Why measure? Abnormal levels can affect reproductive function, libido, and may indicate pituitary issues.
Sex Hormone Binding Globulin (SHBG)
A protein that binds to sex hormones, regulating their availability.
Why measure? Levels are affected by factors including liver function, thyroid health, and insulin levels, making this an important marker for overall hormonal balance.
T4 (Thyroxine)
The main hormone produced by the thyroid gland.
Why measure? Helps evaluate thyroid function and identify potential thyroid disorders that can affect virtually all body systems.
Testosterone
A hormone important for muscle mass, bone density, energy levels, and libido in both men and women.
Why measure? Helps identify imbalances that may affect energy, mood, and physical performance, and monitors age-related decline.
TPO Antibodies
Antibodies that target thyroid peroxidase, an enzyme in the thyroid.
Why measure? Helps identify autoimmune thyroid conditions like Hashimoto's thyroiditis before thyroid function is significantly affected.
TSH (Thyroid Stimulating Hormone)
A pituitary hormone that regulates thyroid function.
Why measure? Helps assess thyroid health, with abnormal levels potentially indicating hypothyroidism or hyperthyroidism affecting metabolism, energy, and overall wellbeing.
Nutritional Status (12 markers)
Active B12
The biologically active form of vitamin B12 that your body can utilise.
Why measure? Essential for energy production, neurological function, and DNA synthesis. Deficiency can cause fatigue and cognitive issues.
Calcium
A mineral essential for bone health, muscle function, and nerve signalling.
Why measure? Abnormal levels can impact bone health, cardiovascular function, and neuromuscular activity.
Chloride
An electrolyte that works with sodium to maintain fluid balance.
Why measure? Helps assess hydration status and acid-base balance in the body.
Ferritin
Measures your body's iron stores.
Why measure? Helps assess both iron deficiency and overload, which can affect energy levels, immune function, and overall health.
Folate (Vitamin B9)
Circulating levels of folate (Vitamin B9), essential for numerous biochemical reactions, including DNA synthesis, red blood cell production, and preventing neural tube birth defects.
Why measure? Crucial for DNA synthesis, cellular division, and methylation processes. Optimal levels support cardiovascular health and cognitive function.
Iron
The amount of iron circulating in your blood.
Why measure? Iron is essential for oxygen transport and energy production. Testing helps identify deficiency which can cause fatigue and reduced performance.
Magnesium
A mineral involved in hundreds of biochemical reactions in the body.
Why measure? Deficiency is common and can affect energy production, muscle function, and cardiovascular health.
Sodium
An essential electrolyte that helps regulate fluid balance.
Why measure? Abnormal levels can indicate dehydration, kidney issues, or hormonal imbalances.
Transferrin Saturation
The percentage of transferrin that is saturated with iron.
Why measure? Provides insights into iron availability and helps identify both deficiency and overload conditions.
Total Iron Binding Capacity (TIBC)
The blood's capacity to bind iron with transferrin.
Why measure? Helps evaluate iron status and distinguish between different causes of anaemia.
Unsaturated Iron Binding Capacity (UIBC)
The amount of transferrin that is not carrying iron.
Why measure? Complements other iron tests to provide a complete picture of iron metabolism and availability.
Vitamin D
Circulating levels of vitamin D, which functions more like a hormone in the body.
Why measure? Deficiency is extremely common and linked to immune dysfunction, bone loss, mood disorders, and increased disease risk.
Vital Organ Functions (11 markers)
Alanine Transferase (ALT)
An enzyme primarily found in liver cells.
Why measure? Elevated levels can indicate liver damage or disease, allowing for early intervention before symptoms develop.
Albumin
The most abundant protein in blood, produced by the liver, important for maintaining blood volume and pressure.
Why measure? Serves as a marker of protein status, nutritional health, and liver function.
Alkaline Phosphatase (ALP)
An enzyme found in liver, bile ducts, and bone.
Why measure? Helps evaluate liver and bone health, with elevated levels potentially indicating liver or bone disorders
Aspartate Transferase (AST)
An enzyme found in the liver, heart, and muscles.
Why measure? Elevated levels can indicate damage to these tissues, especially when considered alongside other liver enzymes.
Bilirubin
A breakdown product of red blood cells processed by the liver.
Why measure? Elevated levels can indicate liver dysfunction or increased red blood cell breakdown.
Creatinine
A waste product filtered by the kidneys.
Why measure? Measures kidney function, which may be affected by high blood pressure and diabetes, and filtration capacity, essential for overall health.
eGFR (estimated Glomerular Filtration Rate)
An estimate of how well your kidneys are filtering blood.
Why measure? Provides a more precise assessment of kidney function than creatinine alone, helping identify decline in kidney function early.
Gamma GT (GGT)
An enzyme primarily found in the liver and bile ducts.
Why measure? Sensitive indicator of liver disease, bile duct issues, or alcohol consumption patterns.
Globulin
A group of proteins in the blood, including antibodies.
Why measure? Helps assess immune function and protein status, with abnormal levels potentially indicating infection or immune disorders.
Total Protein
All proteins found in the liquid part of your blood.
Why measure? Provides information about nutritional status, bone health, liver function, and immune system health.
Urea
A waste product formed from protein breakdown and filtered by the kidneys.
Why measure? Provides information about kidney function and protein metabolism.
Blood Health (15 markers)
Basophils (count and %)
A type of white blood cell involved in allergic responses.
Why measure? Helps evaluate allergic conditions and detect certain rare blood disorders.
Eosinophils (count and %)
White blood cells that fight parasitic infections and participate in allergic responses.
Why measure? Elevated levels can indicate allergies, parasitic infections, or certain autoimmune conditions.
Haematocrit
The percentage of red blood cells in the blood.
Why measure? Helps assess hydration status and screen for conditions affecting red blood cell production.
Haemoglobin
The oxygen-carrying protein in red blood cells.
Why measure? Evaluates oxygen-carrying capacity and screens for anaemia, which can cause fatigue and reduced performance.
Lymphocytes (count and %)
White blood cells essential for immune function.
Why measure? Provides insights into immune system health, with abnormal levels potentially indicating infection or immune system disorders.
Mean Corpuscular Haemoglobin (MCH)
The average amount of haemoglobin per red blood cell.
Why measure? Helps characterise types of anaemia and evaluate overall red blood cell health.
Mean Corpuscular Haemoglobin Concentration (MCHC)
The average concentration of haemoglobin inside red blood cells.
Why measure? Assists in classifying different types of anaemia and red blood cell disorders
Mean Corpuscular Volume (MCV)
Measures the average size of red blood cells.
Why measure? Helps distinguish between different types of anaemia and assess nutritional status/deficiencies including B12 and folate.
Monocytes (count and %)
A type of white blood cell that fights bacteria and helps with tissue repair.
Why measure? Abnormal levels can indicate infection, inflammation, or certain blood disorders.
Mean Platelet Volume (MPV)
The average size of platelets in the blood.
Why measure? Can indicate platelet production rate and bone marrow activity, with implications for cardiovascular and inflammatory conditions.
Neutrophils (count and %)
The most abundant type of white blood cell, which fights bacterial infections.
Why measure? Important for evaluating immune function and detecting infection or inflammation.
Platelets
Cell fragments essential for blood clotting.
Why measure? Screens for bleeding disorders or clotting risks and provides information about bone marrow function and is a risk factor for cardiovascular diseases.
Red Cell Distribution Width (RDW)
Measures the variation in size of red blood cells.
Why measure? Assists in diagnosing different types of anaemia and has been linked to overall health status and mortality risk.
Red Blood Cell Count
The total number of red blood cells per volume of blood.
Why measure? Helps assess oxygen-carrying capacity and screen for conditions affecting red blood cell production or survival.
White Blood Cell Count
The total number of white blood cells in your blood.
Why measure? Provides an overview of immune system activity, with elevated levels often indicating infection or inflammation.
Methylation & Longevity (10 markers)
Active B12
The biologically active form of vitamin B12.
Why measure? Works with folate in methylation pathways, influencing energy production, neurological health, and cellular repair mechanisms.
Cortisol
The primary stress hormone.
Why measure? Chronic stress affects methylation patterns and can accelerate cellular ageing processes.
D.H.E.A. Sulphate
An adrenal hormone that declines predictably with age.
Why measure? Associated with methylation efficiency and overall longevity potential.
Folate (Vitamin B9)
Circulating levels of folate (B9), a critical methyl donor.
Why measure? Essential for methylation processes, DNA synthesis, and repair. Optimal levels support cellular health and longevity.
FT3 (Free Triiodothyronine)
The unbound, biologically active form of T3, the most potent thyroid hormone.
Why measure? Essential for cellular energy production and metabolic regulation, which influence methylation efficiency and cellular ageing processes.
HbA1c
Measures your average blood glucose over the past 2–3 months.
Why measure? Glycation damages proteins through non-enzymatic processes that compete with methylation pathways, affecting cellular ageing and longevity.
hsCRP (High-sensitivity C-reactive protein)
Low-grade inflammation throughout your body.
Why measure? Chronic inflammation alters methylation patterns and accelerates ageing processes.
T4 (Thyroxine)
The main hormone produced by the thyroid gland.
Why measure? Impacts overall metabolic rate and energy regulation, affecting methylation efficiency and cellular health.
TSH (Thyroid Stimulating Hormone)
A pituitary hormone that regulates thyroid function.
Why measure? Thyroid regulation influences methylation-dependent metabolic processes and cellular ageing patterns.
Vitamin D
Circulating levels of vitamin D.
Why measure? Influences gene expression through epigenetic mechanisms related to methylation and is associated with longevity.
StrideAge
Using your blood biomarker results, we calculate your StrideAge using a scientifically validated biological age algorithm. Discover your pace of ageing - whether you're ageing faster or slower than your chronological years - and track improvements over time as you optimise your health.

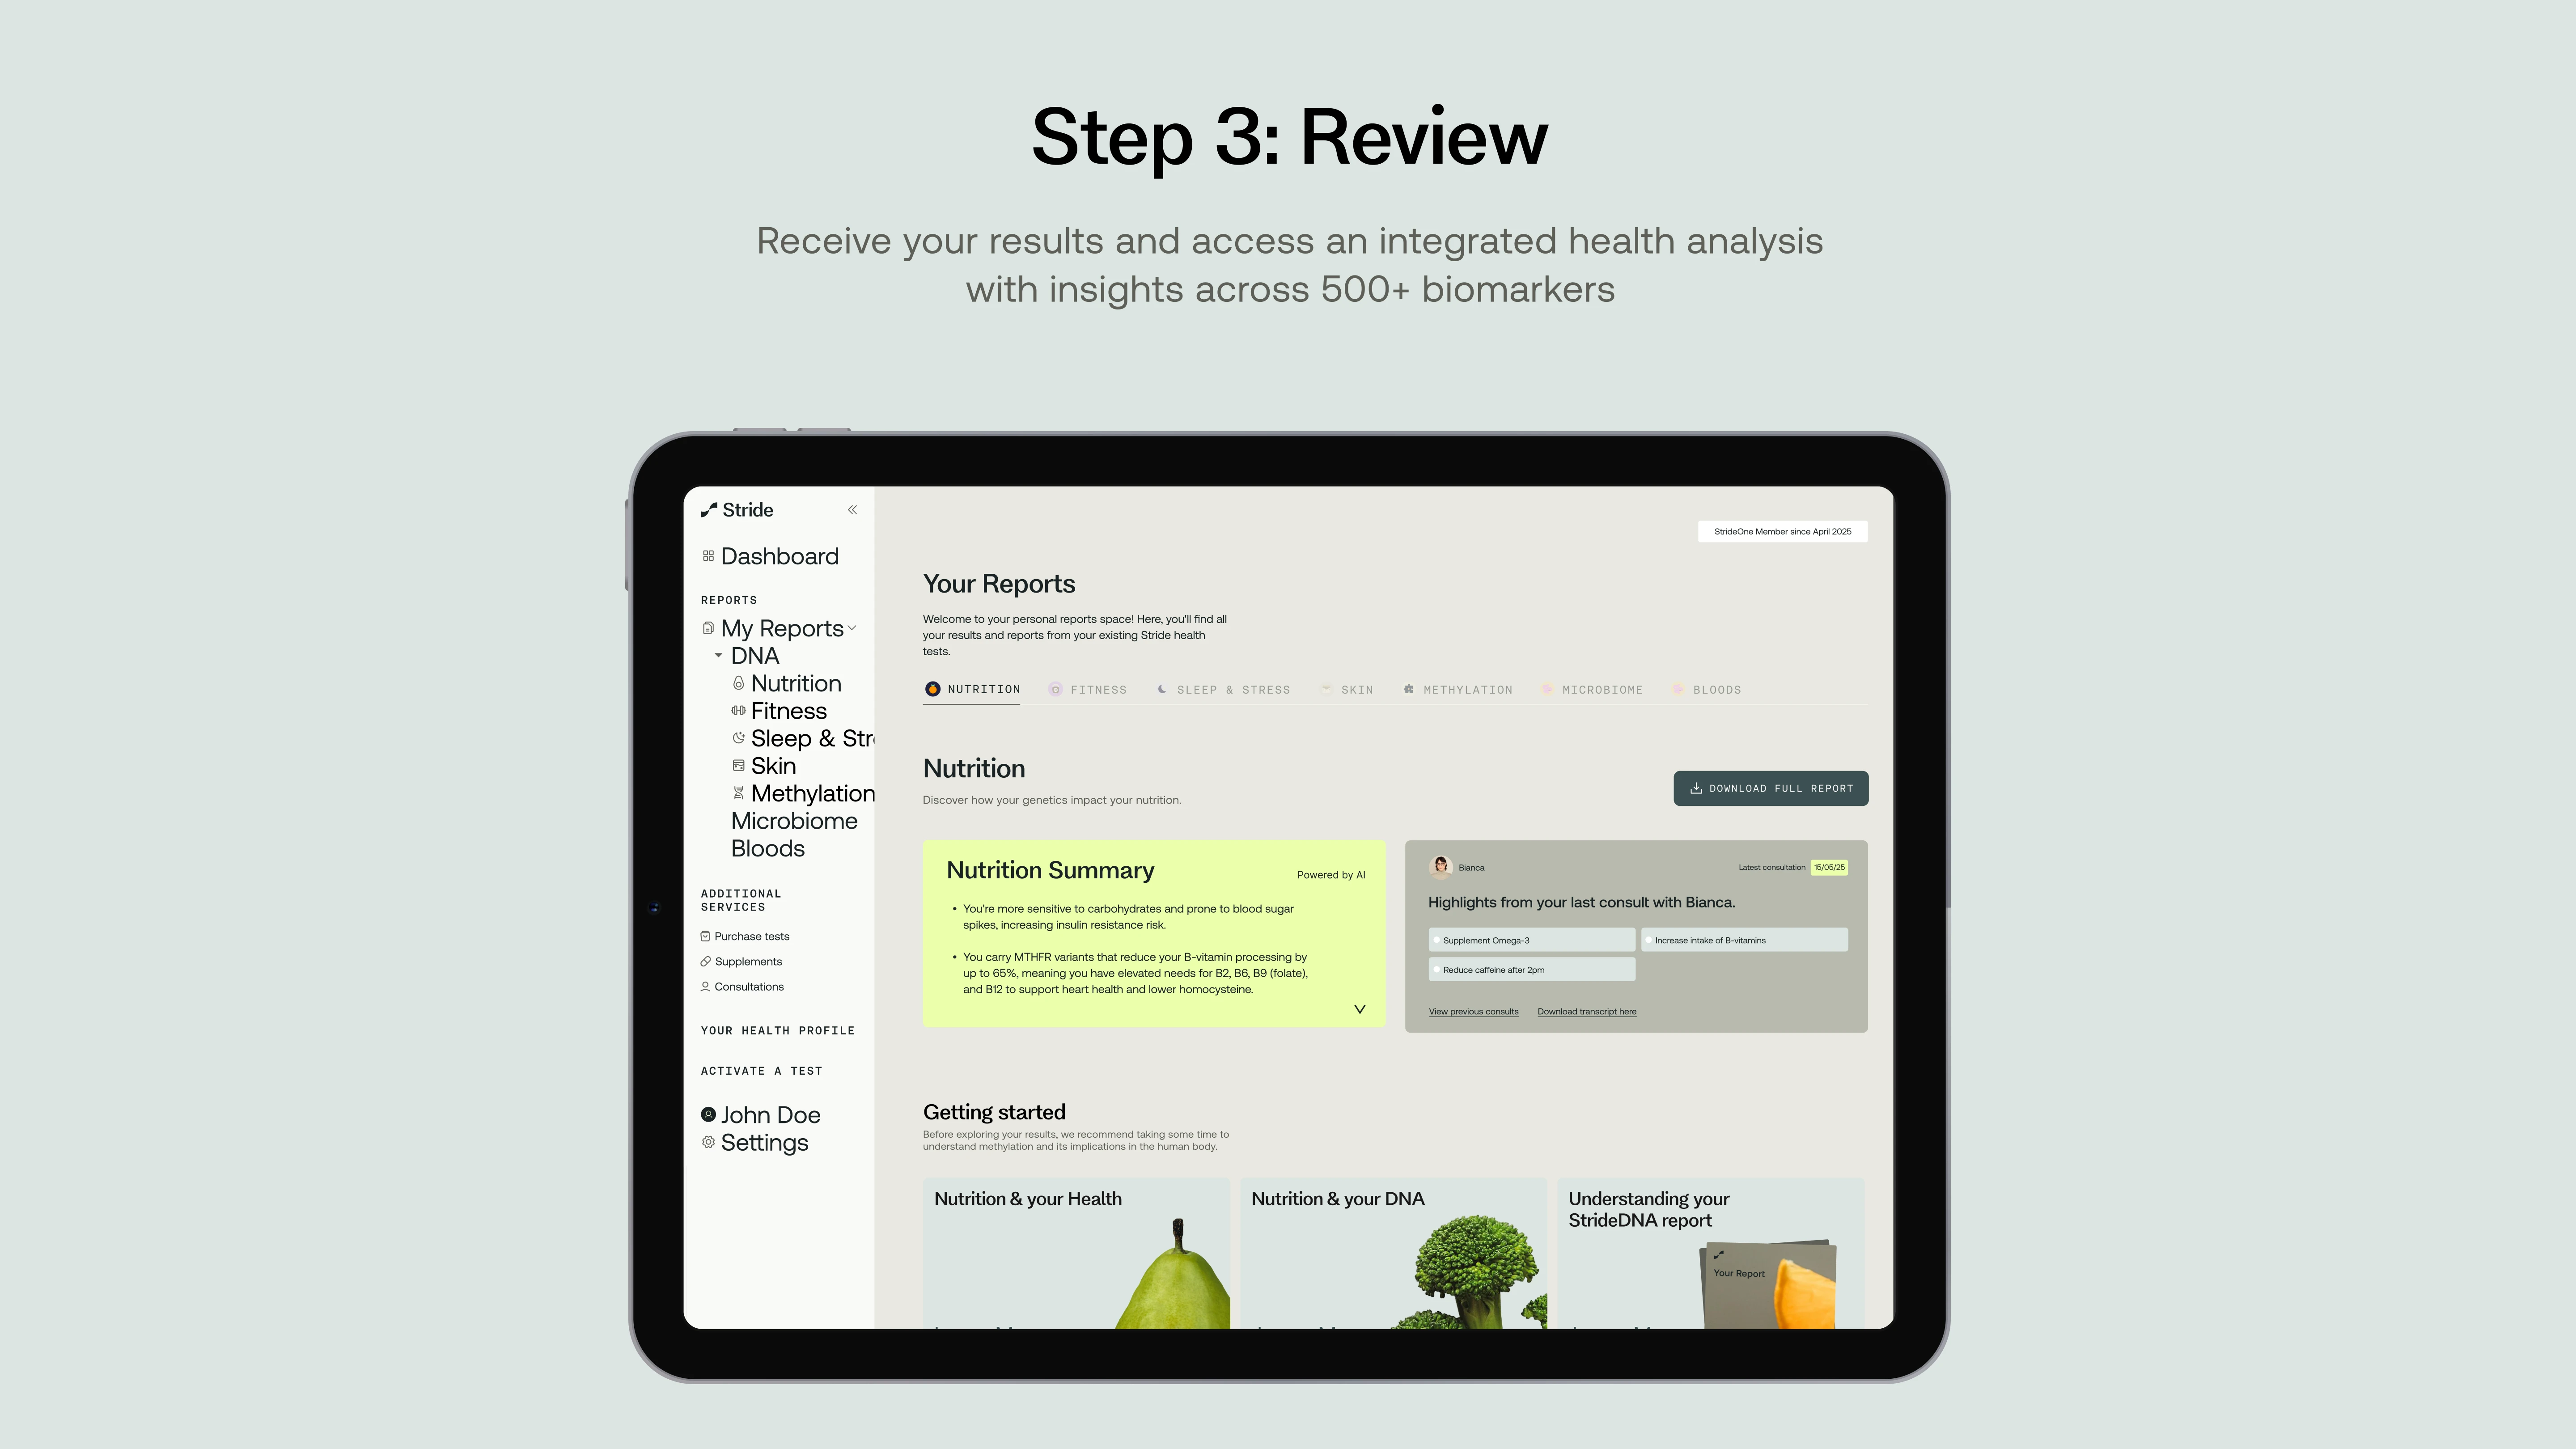
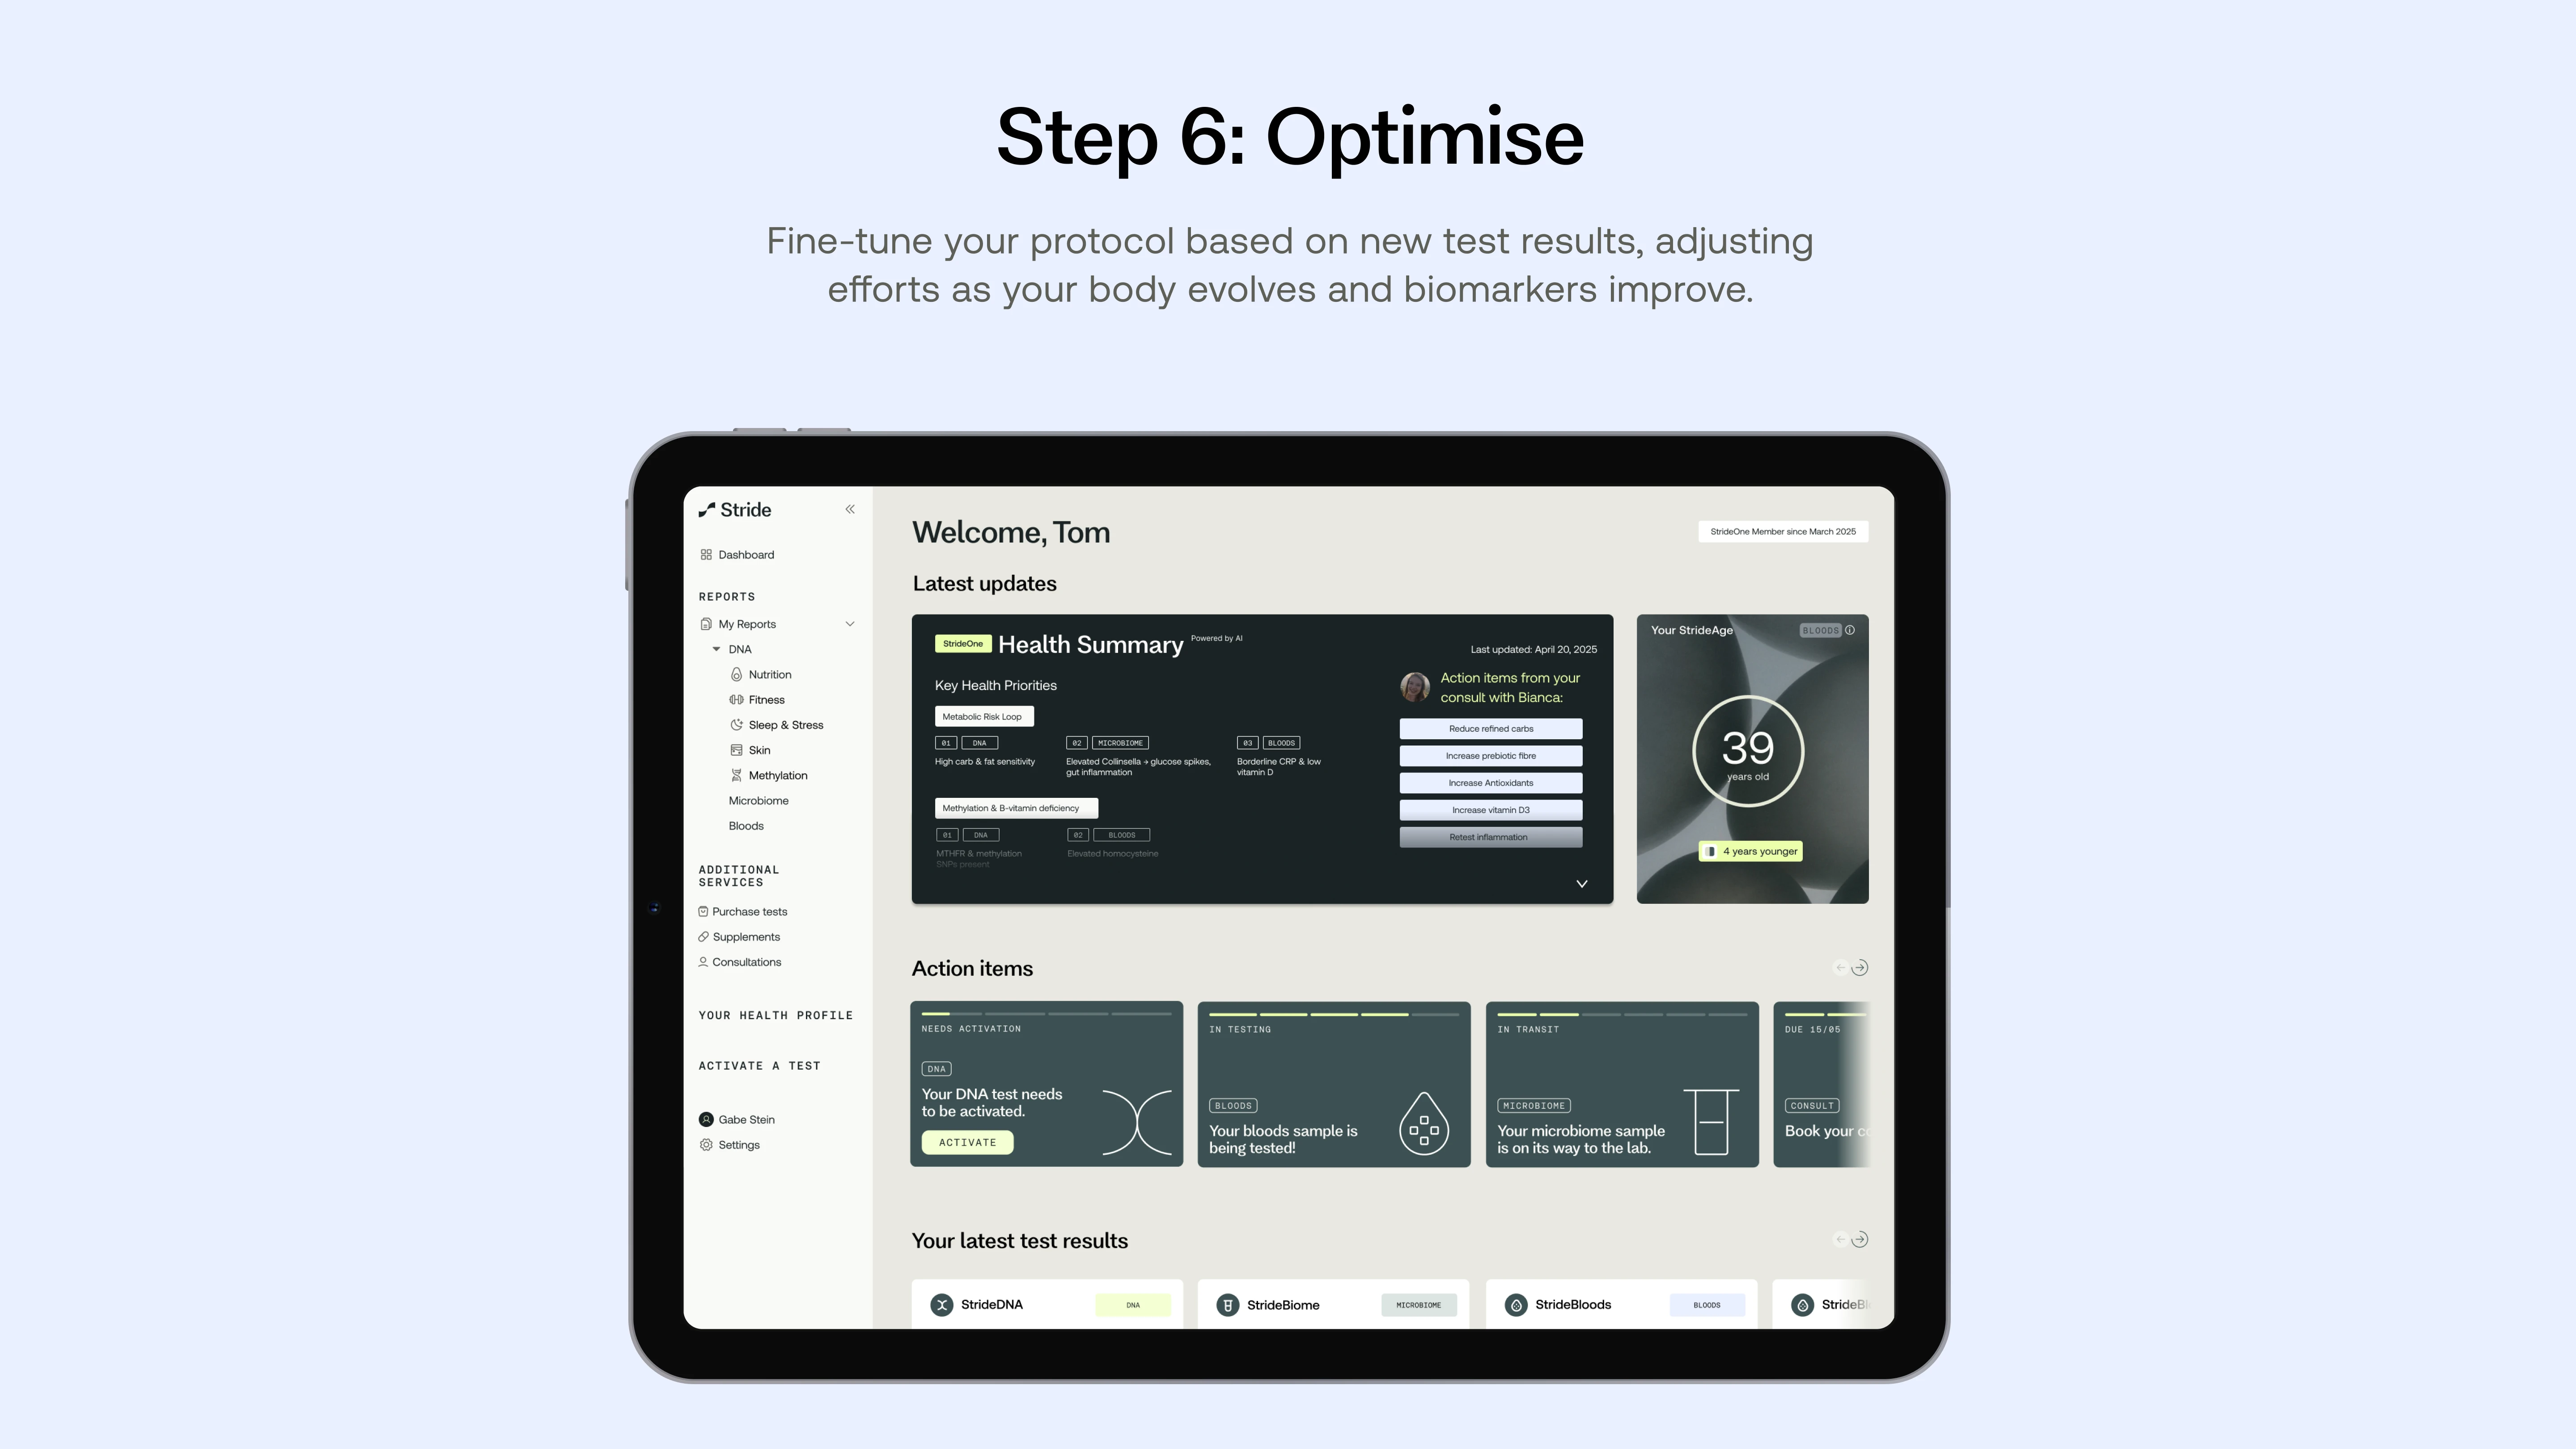
Meet MyStride.
Experience a new way to track and optimise your health with MyStride. Our secure, intuitive platform brings together all your test results, integrated summaries, and supplement recommendations. Access your health dashboard, track your progress, and stay connected with our team - anytime, anywhere.
Quarterly expert consultations.
Your health data is only as valuable as the expert interpretation behind it. Every StrideOne member receives quarterly 1:1 consultations with a dedicated health coach (e.g. Dietetics and Physiology Experts) who specialises in precision health and longevity.
Qualified Health Experts
Work directly with registered dietetics and physiology experts passionate about integrated health optimisation.
Personalised Protocol Development
Receive custom health protocols based on your unique genetic profile, microbiome, and blood biomarkers.
Progress Review & Optimisation
Monitor biomarker improvements and adjust action plans with data-driven refinements based on your bi-annual retest results.
Ongoing Support
Between consultations, access your health coach for questions, protocol adjustments, and motivation to stay on track.

Progress starts with clarity.
What to expect as a StrideOne member.


Join StrideOne Waitlist
Transform your health with data-driven insights and expert support.
For the curious.
What is StrideOne?
StrideOne is the UK’s first fully integrated health testing membership. Instead of one-off tests or siloed reports, StrideOne connects your DNA, gut microbiome, blood biomarkers and biological age — into one system. It’s like a wearable for your internal biology, turning health tracking into an ongoing habit. You’ll retest key markers every 6 months, speak with a dedicated coach quarterly, and use your MyStride dashboard to monitor exactly what’s working — and what’s not — so you can keep optimising your health for complete clarity.
What's included in a StrideOne membership?
Integrated analysis of 500+ advanced DNA, Gut, Blood + Bioage markers. (gut microbiome, blood and bioage tested twice yearly).
Who is StrideOne for?
StrideOne is built for people who want to take real ownership of their internal health. Whether you're already tracking your fitness and sleep, or just getting started, it's for those who value clarity, want to improve long-term health, and are ready to build a smarter, more personalised approach — one that evolves with their biology. From boosting energy and focus, to reducing gut issues or ageing better — StrideOne helps you track what matters and act on it.
How often do I test and review my progress?
You’ll begin with a full round of testing: DNA, gut health, blood biomarkers, and your StrideAge. Once your data is live in MyStride, you'll meet your dedicated Stride expert for your first 1:1 consultation — to turn insight into action.
After that:
- Every 3 months: video consultation to review progress and refine strategy
- Every 6 months: repeat blood and gut testing to track improvements (DNA only once)
- Ongoing: unlimited chat/email access to your coach
After each cycle, MyStride updates automatically with new results and recommendations — driving a continuous habit loop: Measure --> Optimise --> Retest --> Improve.
How quickly will I receive my test results?
Once you’ve completed your Stride tests, here’s when to expect your results: • StrideDNA: ~10 business days • StrideBiome: ~20 business days • StrideBloods: ~7 business days Most members receive their full results set within 3–5 weeks. Your Stride expert consultation is scheduled shortly after.
Where do I see my results?
Your data lives in one secure place: MyStride. There, you can:
- Review all Stride test results
- View biomarker trends over time
- See your StrideAge (biological age) and how it changes
- Monitor improvements in key health markers
- Review updated insights and recommendations after each testing cycle
What makes StrideOne different from taking individual tests?
With individual health tests, you get useful data — but no system. StrideOne gives you complete health clarity by connecting your test results into an integrated overview — and supporting you with expert coaching every step of the way. It’s smarter, habit-forming, and built for action.
What if I've already done StrideDNA or other Stride tests?
Great — you’re ahead of the curve. If you’ve already done your StrideDNA or StrideBiome test, your results will automatically be integrated into your new membership. We’ll just build from there — adding retests, coaching, blood insights and biological age to give you a full 360° picture of your health.
Is this available outside the UK?
Currently, StrideOne is only available in the UK. We're working on international expansion — sign up to our newsletter or follow @get_stride on Instagram to hear when new regions open.
What if I’m not happy?
We stand by our membership — and our mission to help you live healthier, longer. That’s why we offer a 30-day money-back guarantee. If StrideOne isn’t right for you, we’ll refund your membership (terms apply).